Analysis: Exploring the numbers and trends behind Liverpool’s shot conversion and xG this season
If you were to look at the Premier League table, you’d think that Liverpool were among the most efficient teams in the top flight.
The Reds’ tally of 72 goals in 32 matches is the third-highest in the division, consistent with their actual position, with an average of 2.25 goals per game. All five of Jurgen Klopp’s senior forwards are into double digits for the season in all competitions, with Mo Salah and Darwin Nunez netting 41 times between them.
And yet, the Merseysiders now stand accused of being one of the most wasteful teams in the Premier League, all too often spurning chances that you’d expect them to put away easily.
FOLLOW Empire of the Kop on Instagram (@empireofthekop) HERE
Having scored in all but one of their first 49 matches this season, Liverpool have registered zero goals in their subsequent two games. One of the most lethal teams in England has suddenly forgotten how to execute that most straightforward of football principles – sticking the ball in the back of the net.
Is our recent profligate nature a curious blip, or is there an underlying trend which should seriously worry Klopp? We’ve delved into the numbers in search of patterns to the Reds’ shooting efficiency and xG performance in the 2023/24 Premier League, analysing data from FBref.
READ MORE: ‘Conversations took place’: Fabrizio Romano drops concerning Liverpool manager update
Liverpool shot efficiency in 2023/24 Premier League
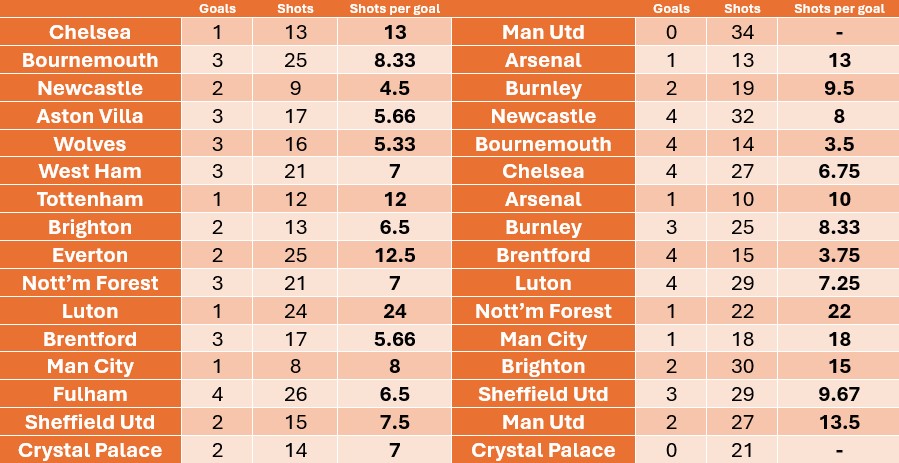
Take one look at those two most recent games. Two goals from 48 shots, and only one point to show for it. It’s quite the contrast from the efficiency Liverpool showed in February, when in three consecutive matches they netted 11 times from 69 attempts at goal.
The Reds were generally clinical in their first 16 league fixtures of the season, usually netting at least once from eight shots or fewer, with outliers in trips to Chelsea (1-1), Tottenham (1-2) and especially Luton (1-1) where we dropped points.
Indeed, we had only one shot fewer at Kenilworth Road than we did in our subsequent two games, which yielded four goals.
In a startling snippet of how football can be a downright illogical sport sometimes, Liverpool took more than twice as many shots in drawing 0-0 at home to Manchester United in December as they did in scoring four times at Bournemouth just five weeks later.
From Boxing Day to the end of February, the Reds were efficiency personified, with 10 or fewer shots per goal in eight consecutive games. Our first seven Premier League matches of 2024 saw us net 24 times.
In six outings since that hot streak, only once have Klopp’s side kept their shots-per-goal tally to single digits, and even that was borderline with three goals from 29 attempts (one every 9.67 shots) in the home win over rock-bottom Sheffield United.
The tables below reflect Liverpool’s best and worst six matches for shooting efficiency in the league this season:

The dates of the half-dozen games in either column are as striking as the corresponding numbers. Three of Liverpool’s five most clinical matches in terms of shot conversion were in the first five weeks of the season, while five of the seven worst for the entire campaign have been from their six most recent outings.
It’s mind-boggling to think that the Reds scored seven goals in their two clashes against Brentford from a combined tally of 32 shots, two attempts fewer than they recorded in the goalless draw against Manchester United in December.
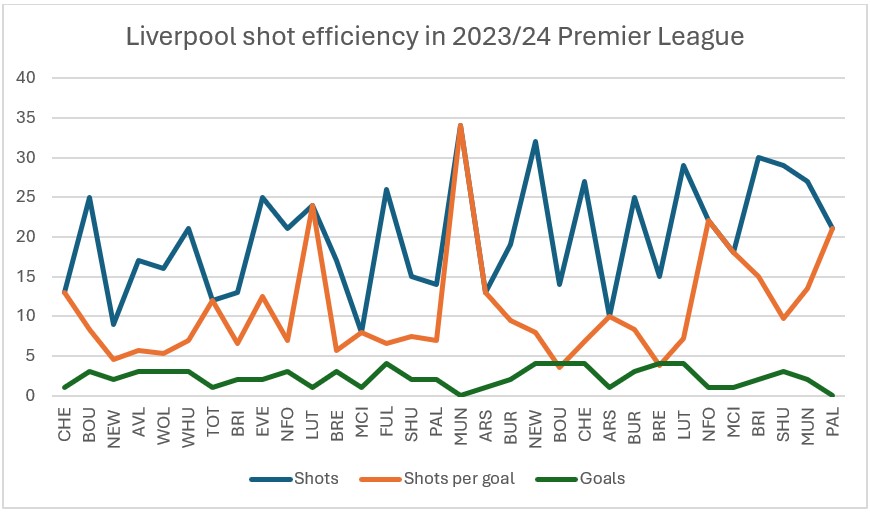
Liverpool’s shot conversion for the season overall is mapped out below, with the red line only once dipping below 10 since the beginning of March:
Liverpool xG performance in 2023/24 Premier League
Ah, expected goals (or xG for short). An obsession for some football observers, an unnecessary evil for others.
Ultimately, all that counts is the tally you’d see when clicking on the Results tab and scouring through the list of final scorelines, but in this era of data, data and more data, the more curious of fans can’t help but delve deep into the underlying numbers behind the simple 0-0, 1-0, 2-2 or whatever the scoreboard might read.
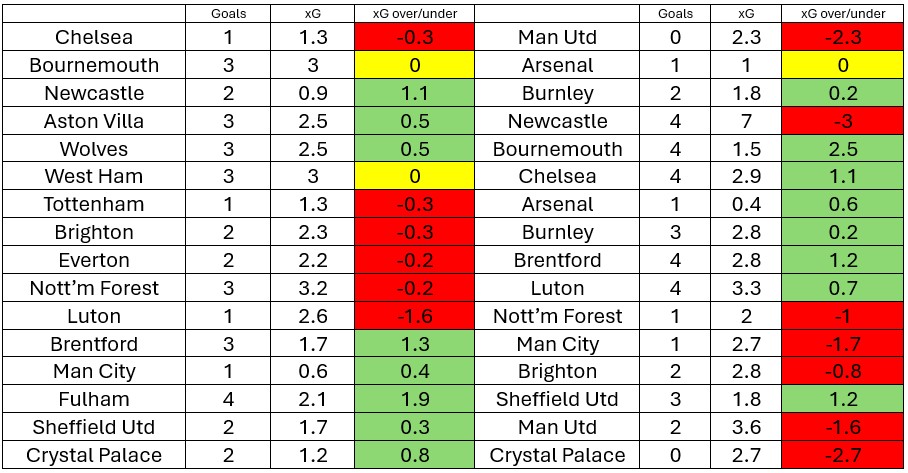
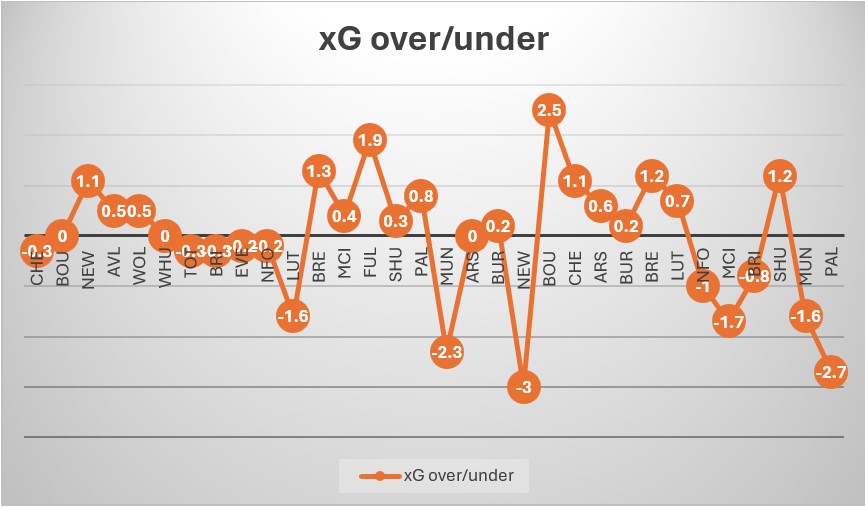
From Liverpool’s xG figures for the season, we can see that the Reds have tended to have prolonged imbalances rather than a constant fluctuation.
They went from underperforming on that metric for five consecutive games in the autumn to overperforming on it in the next five. After a brief up-and-down spell over the festive period, Klopp’s side exceeded their xG in six successive matches before underperforming on it for five of the next six.
Another trend to emerge from our xG performance this term is that the disparity of actual goals to xG has tended to be much more pronounced in the second half of the campaign.
Only once in Liverpool’s first 10 league matches was there a difference greater than one (and even that was +1.1 in the win at Newcastle in August).
Compare that to our eight most recent games, where the xG disparity has been one or greater in six of those – and the two exceptions were +0.7 in the win over Luton and -0.8 in the victory against Brighton.
The tables below reflect Liverpool’s best and worst six matches for xG performance in the league this season:

Of the 12 games with the biggest xG disparity (for better or for worse), five of those have been among our eight most recent league matches, thus highlighting how the differential has generally widened from earlier in the season.
While three of the five worst xG performances have come in our last five games, one match in that period actually features among the best five of the campaign, namely the win over Sheffield United at Anfield.
Curiously, our biggest xG underperformance of the season actually came in the 4-2 win over Newcastle on New Year’s Day.
Liverpool’s xG for the season overall is mapped out below, with the disparities clearly greater in the rightmost half of the graph:
Conclusion
While the eye test would tell you that Liverpool have been far too wasteful in recent games, the underlying numbers also prove it.
Ever since the beginning of March, the Reds have needed an exorbitant number of attempts to even manage one goal, and the xG figures don’t make for pretty reading throughout that period.
When we were scoring 11 goals in the space of a week against Sparta Prague in the Europa League round of 16, you wouldn’t have thought that, little more than a month later, we’d be here analysing problems in the final third for Klopp’s side.
However, with Liverpool’s European adventure on the brink of ending at the quarter-final stage, and their Premier League title hopes in danger of slipping away, the Reds need to get back to their clinical and efficient best as their legendary manager enters the final month of a reign which began way back in October 2015.
The post Analysis: Exploring the numbers and trends behind Liverpool’s shot conversion and xG this season appeared first on The Empire of The Kop.


 EOTK Insider with Neil Jones: Niko Kovac rumours, what if Amorim stays at Sporting? Summer contract calls, Crystal Palace review and much more!