

Ironman 70.3 Weymouth 2019: Age Group Results and 70.3 Qualification
While I wait for results from Ironman Korea to become available, here’s a look at some statistics for Ironman 70.3 Weymouth. I rarely review the data in details for Ironman 70.3 events outside of the World Championship, but reviewing Weymouth gives me the opportunity to highlight some updates to my statistics.
Firstly, you can now look at a large set of statistics on qualification for the Ironman 70.3 World championships here. I’m rapidly growing my database of 70.3 results so I can offer the same depth of statistics as for Kona qualification. Along with this I’m now able to look at slot allocations and qualifying times at 70.3 races. So, I can tell you that Ironman 70.3 Weymouth starts with a standard 40 slots for the 70.3 World Championship and then adds another 25 slots to the women’s age groups as part of their Women-for-Tri program.
Unfortunately, while I can process standard slot allocations for 70.3 races, I’ve got more work to do to handle these additional slots. I’ve treated them much like I’ve treated additional slots at other races (for specific nationalities or the military for example) and not factored them in. I’m keen to see how they’ve been allocated so I can update my allocation algorithm to handle them though.
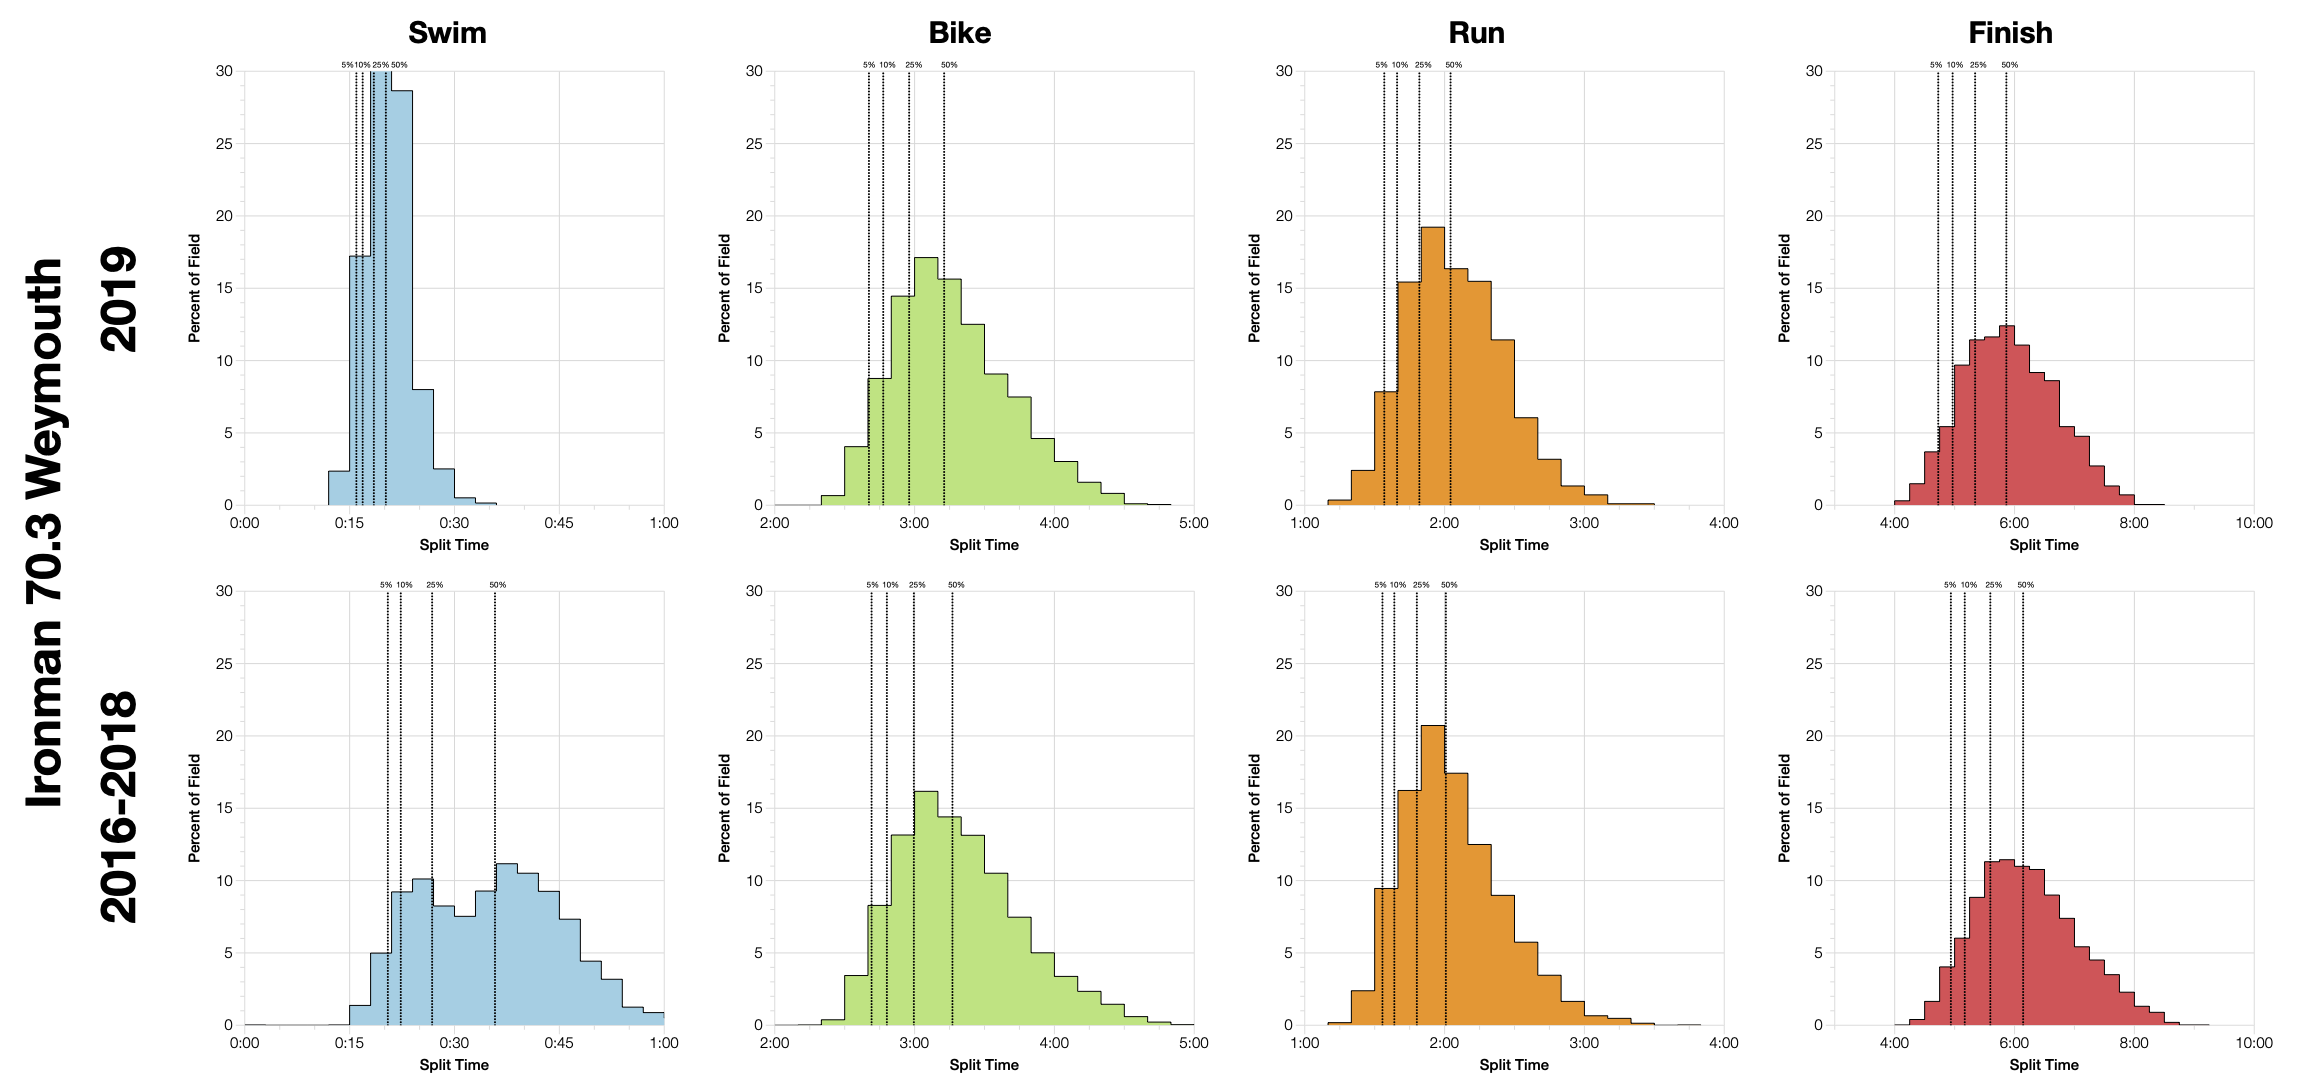
For the second year in a row the Weymouth swim was short. We can see the shortened 2018 swim creating a double bump in the amalgamated data’s swim splits. A shortened swim makes it hard to compare splits – the swim is obviously faster and the change also shifts overall times. Bike and run distributions trend remarkably similarly to the past results with the bike being at most a few minutes faster at the median.
DNF rates for Weymouth this year are at a level which appears normal for the course. Highest on the bike and low levels on both swim and run.
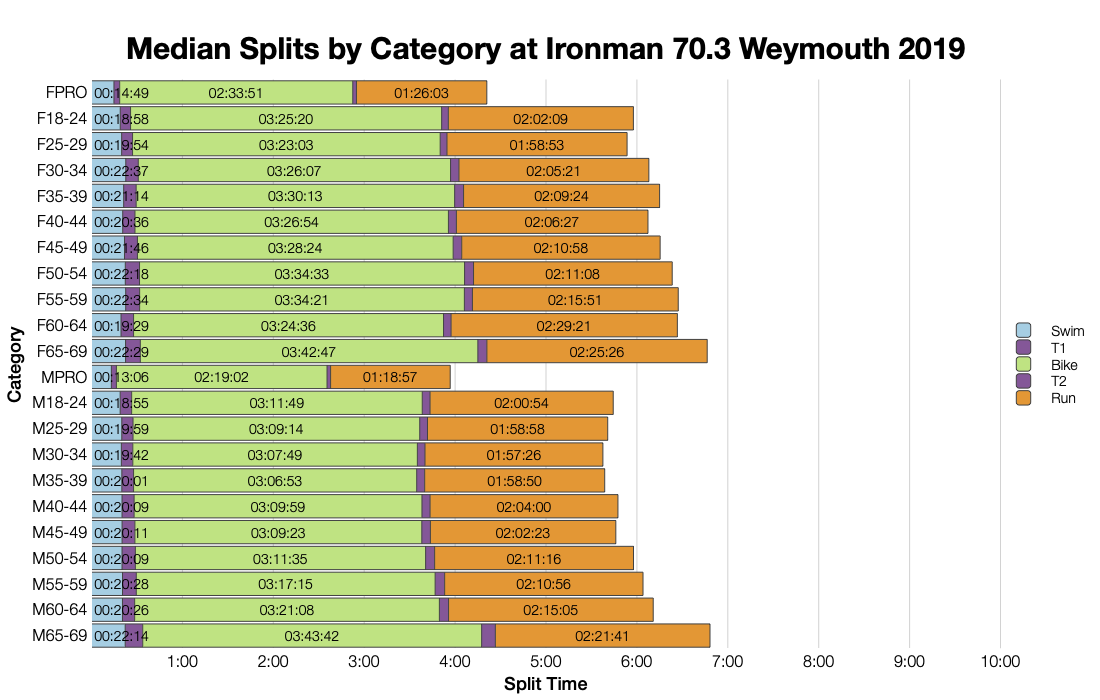
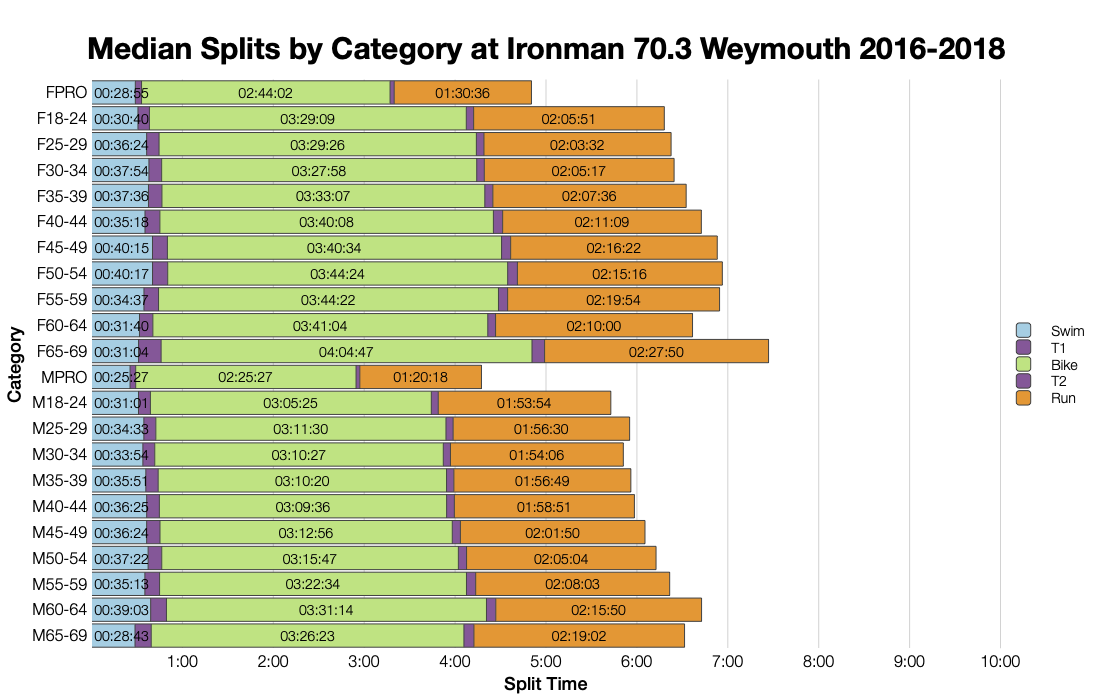
Age group medians repeat the trends of the distributions – a shorter, faster swim followed by bike and run medians that closely match those form before.
Most competitor come from the UK, but 10% are from further afield. So slots tend to stay in the UK with a few going elsewhere. Note that this doesn’t include the Women-for-tri slots. I’ll also mention the 2.5% shortage in slots reflects one slot that went into roll down due to no finishers in its age group. Weymouth has been good for highlighting areas of the system I can improve!
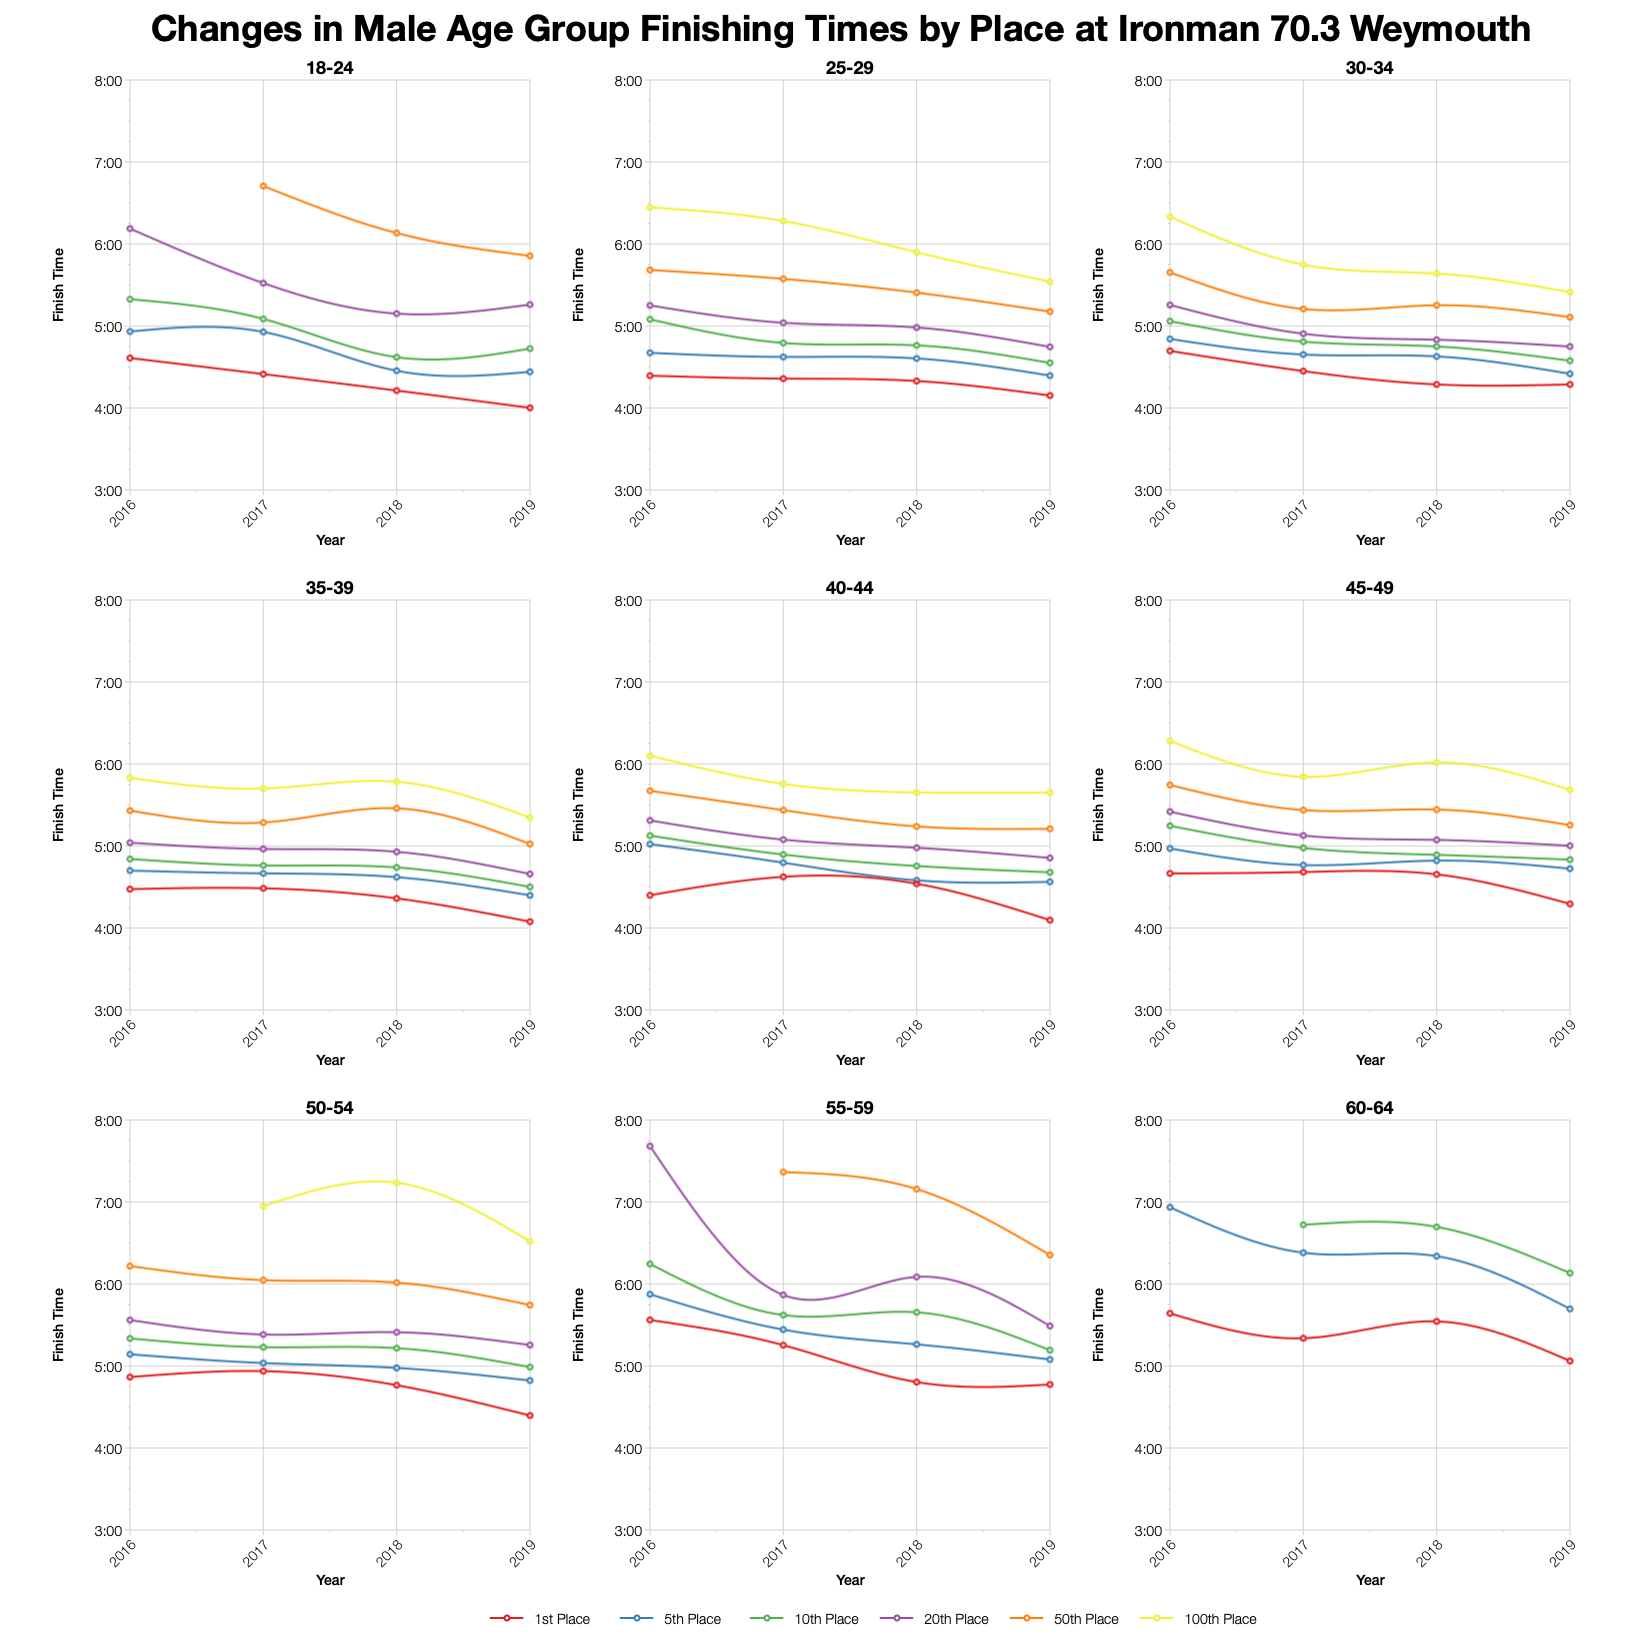
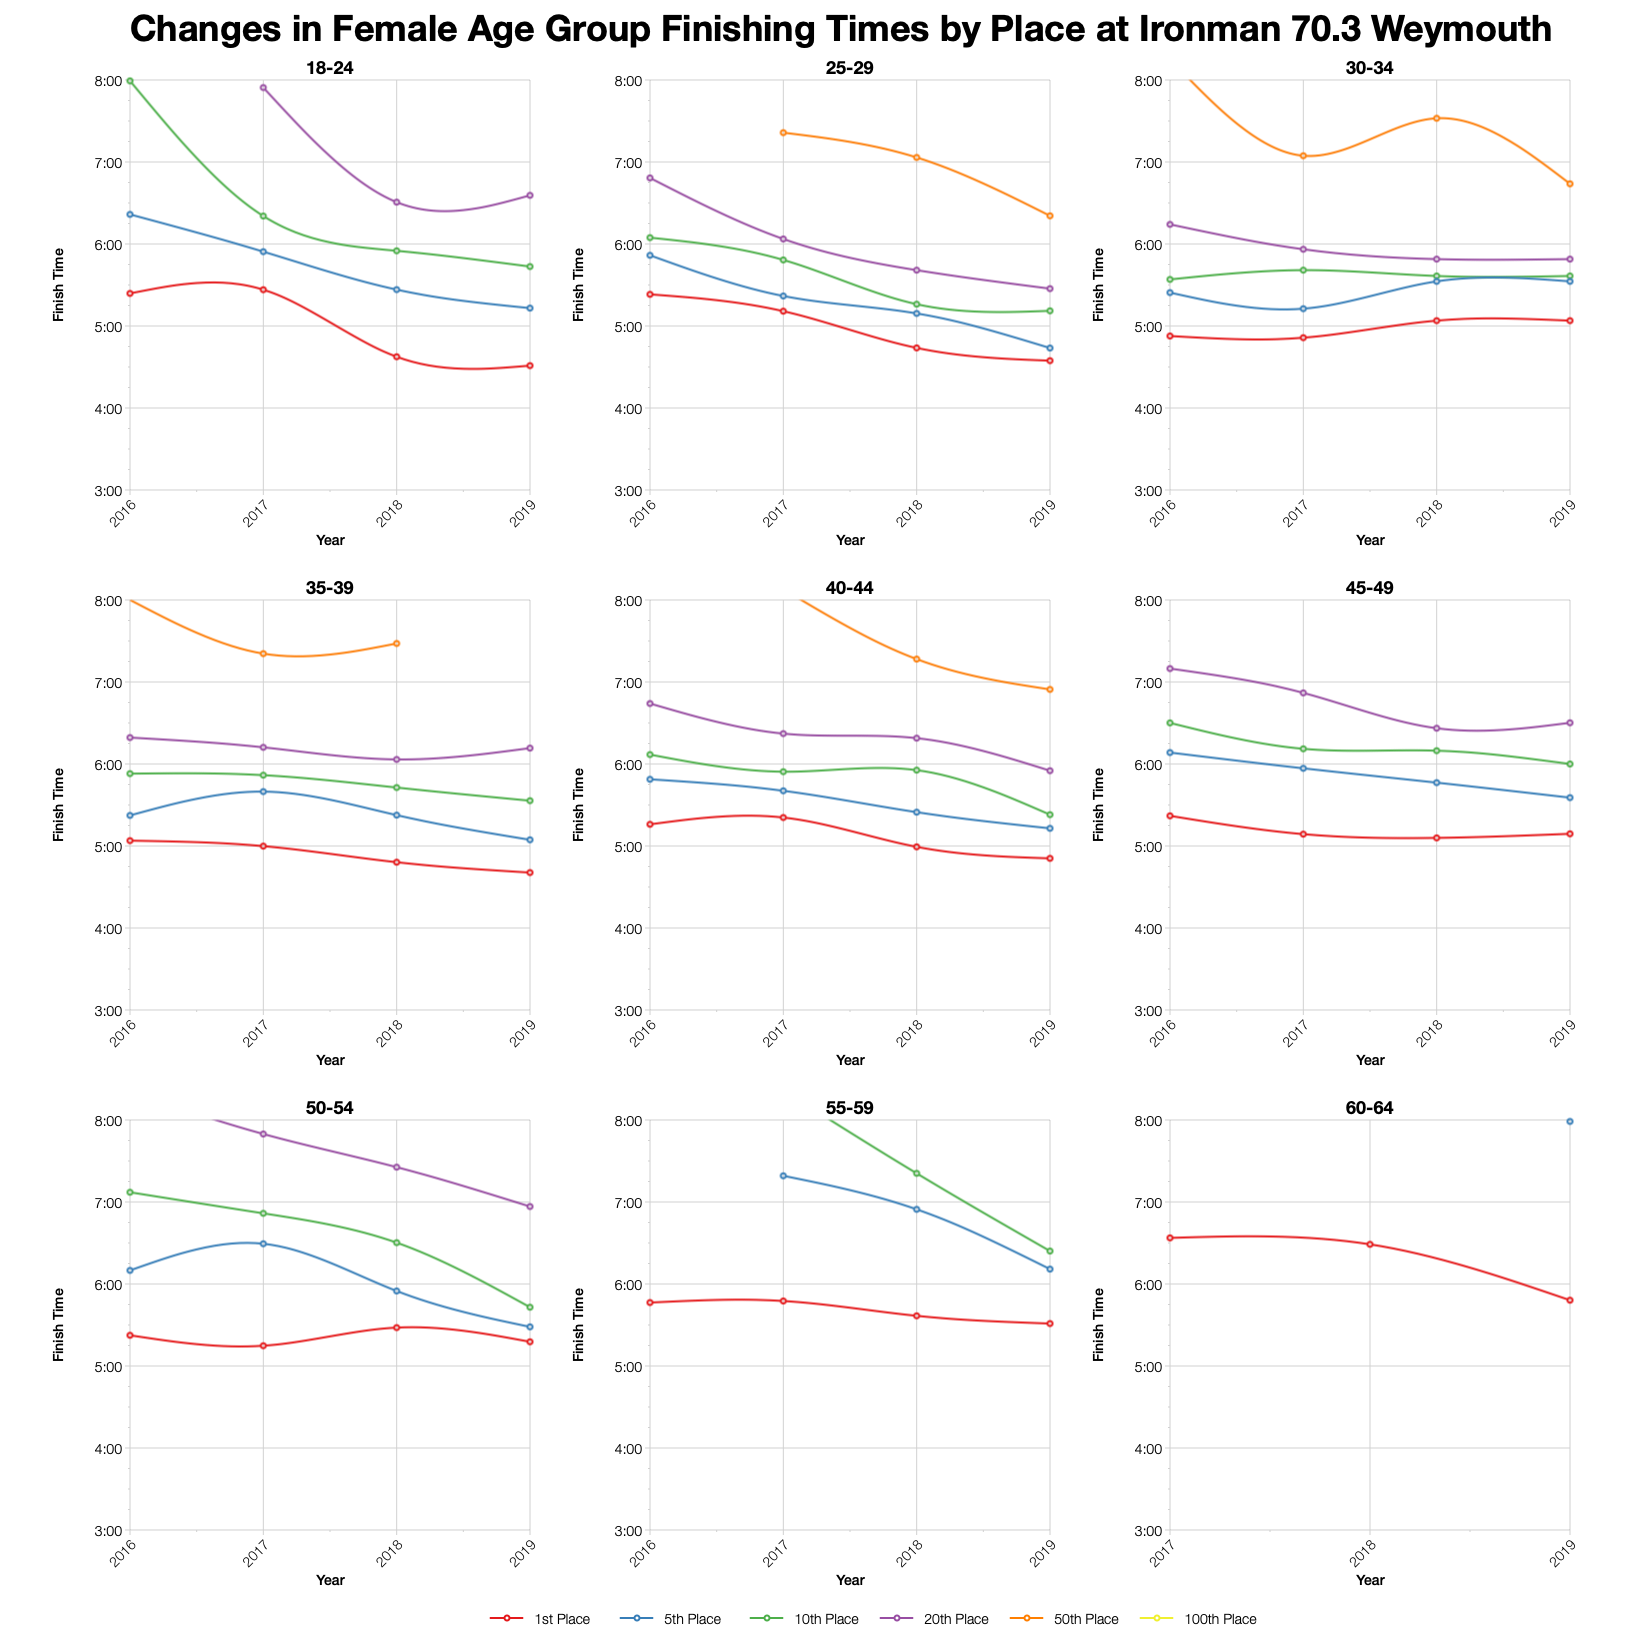
The trend towards faster times shown in the age group positions charts above is mostly due to two years of shortened swims. Without that the course results look like they would have been quite stable.
Based on the start list I’ve calculated the allocation of the main 40 70.3 slots on offer. This doesn’t factor Women-for-Tri slots or roll downs so the final allocation will vary. Women’s age groups will all have distributions more comparable with the men’s. You can compare this with other races on my Ironman 70.3 Championship Qualification page.
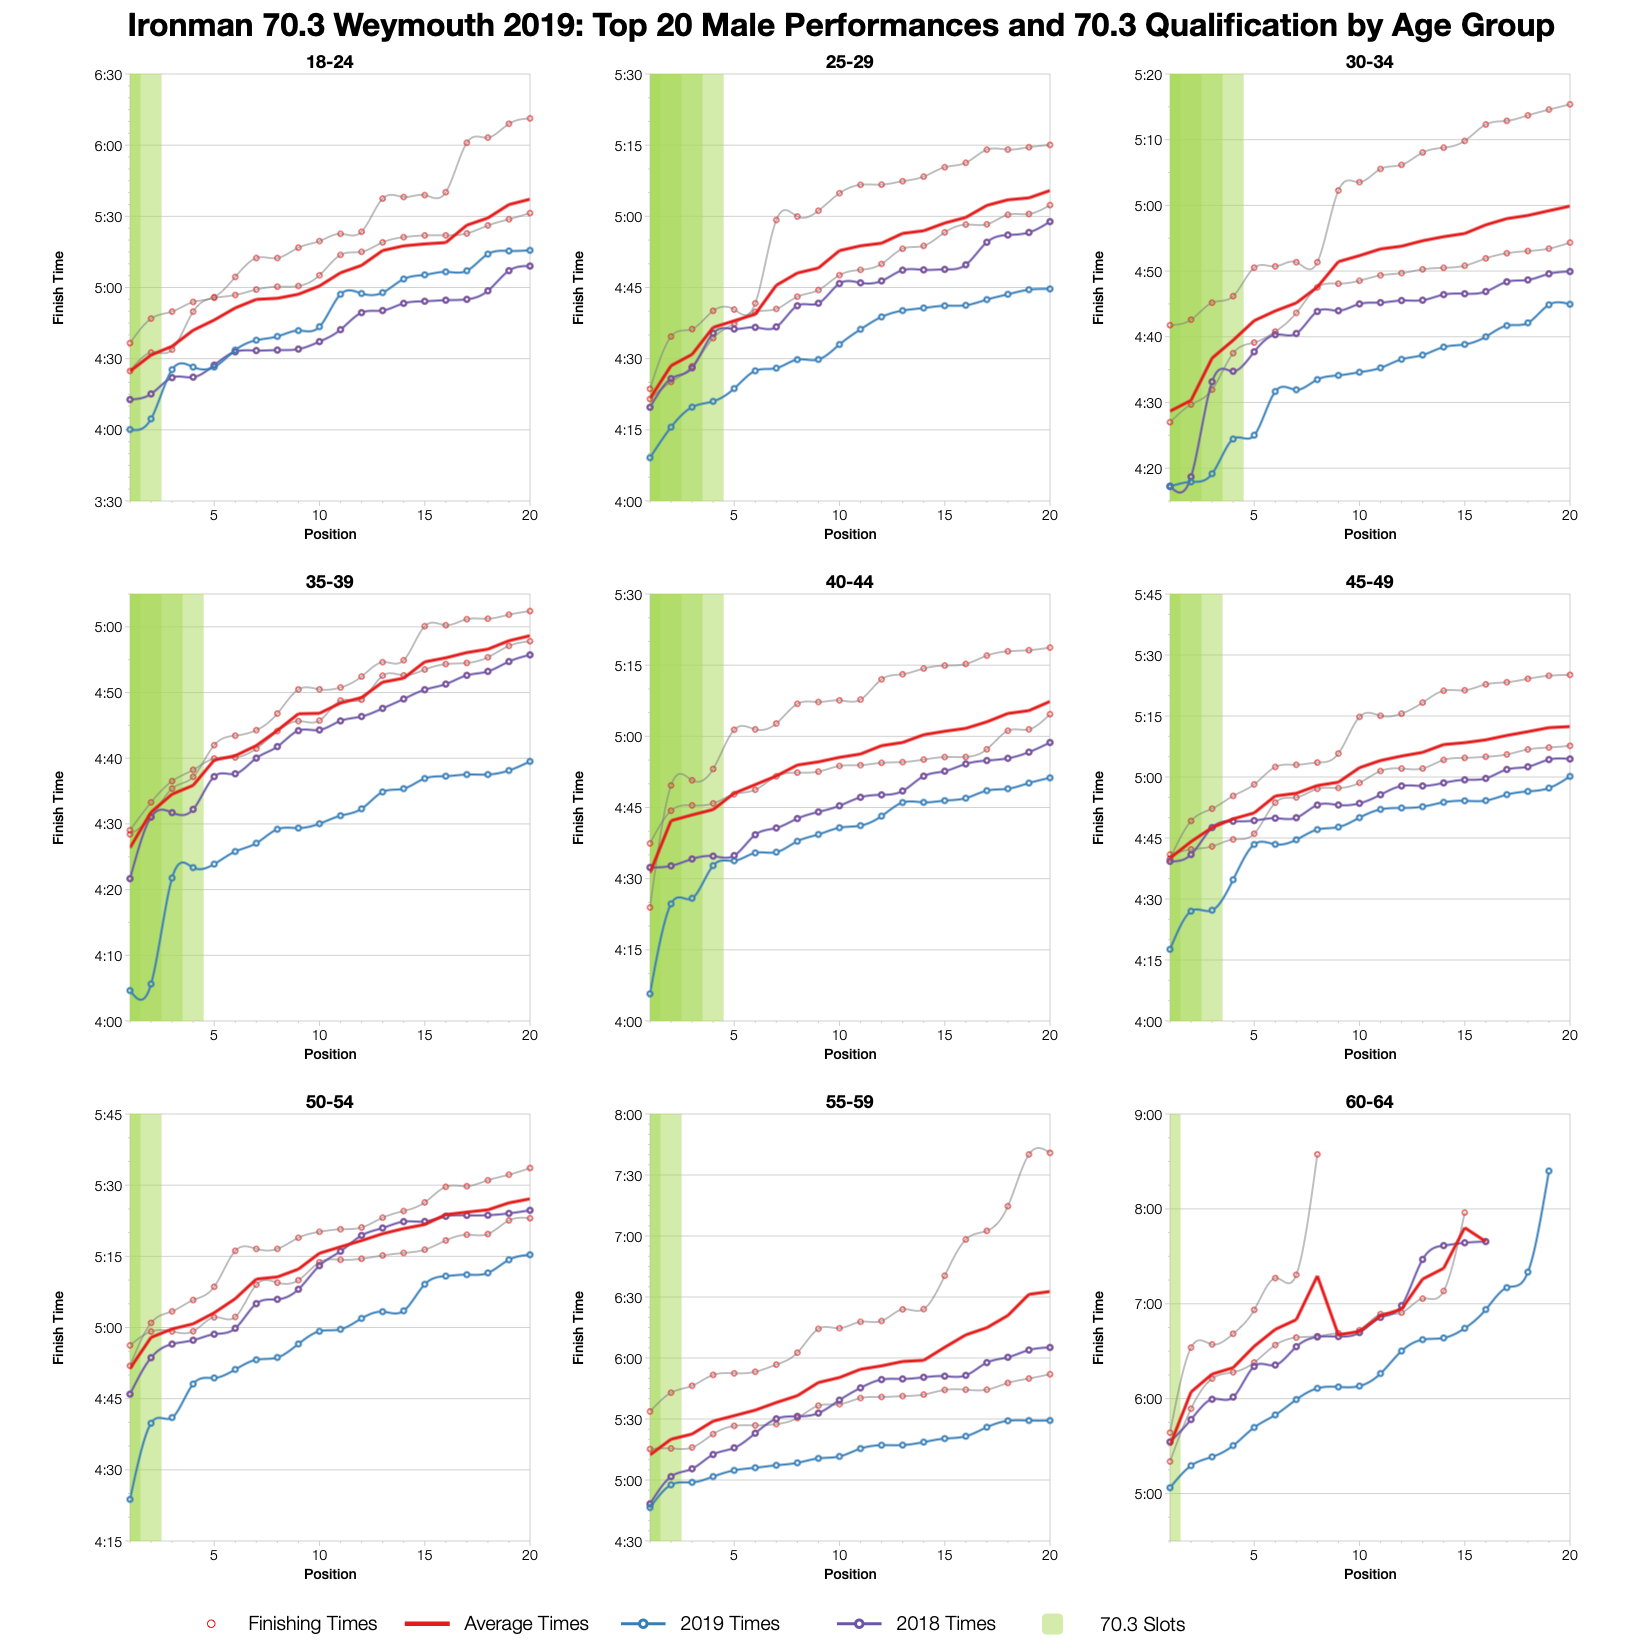
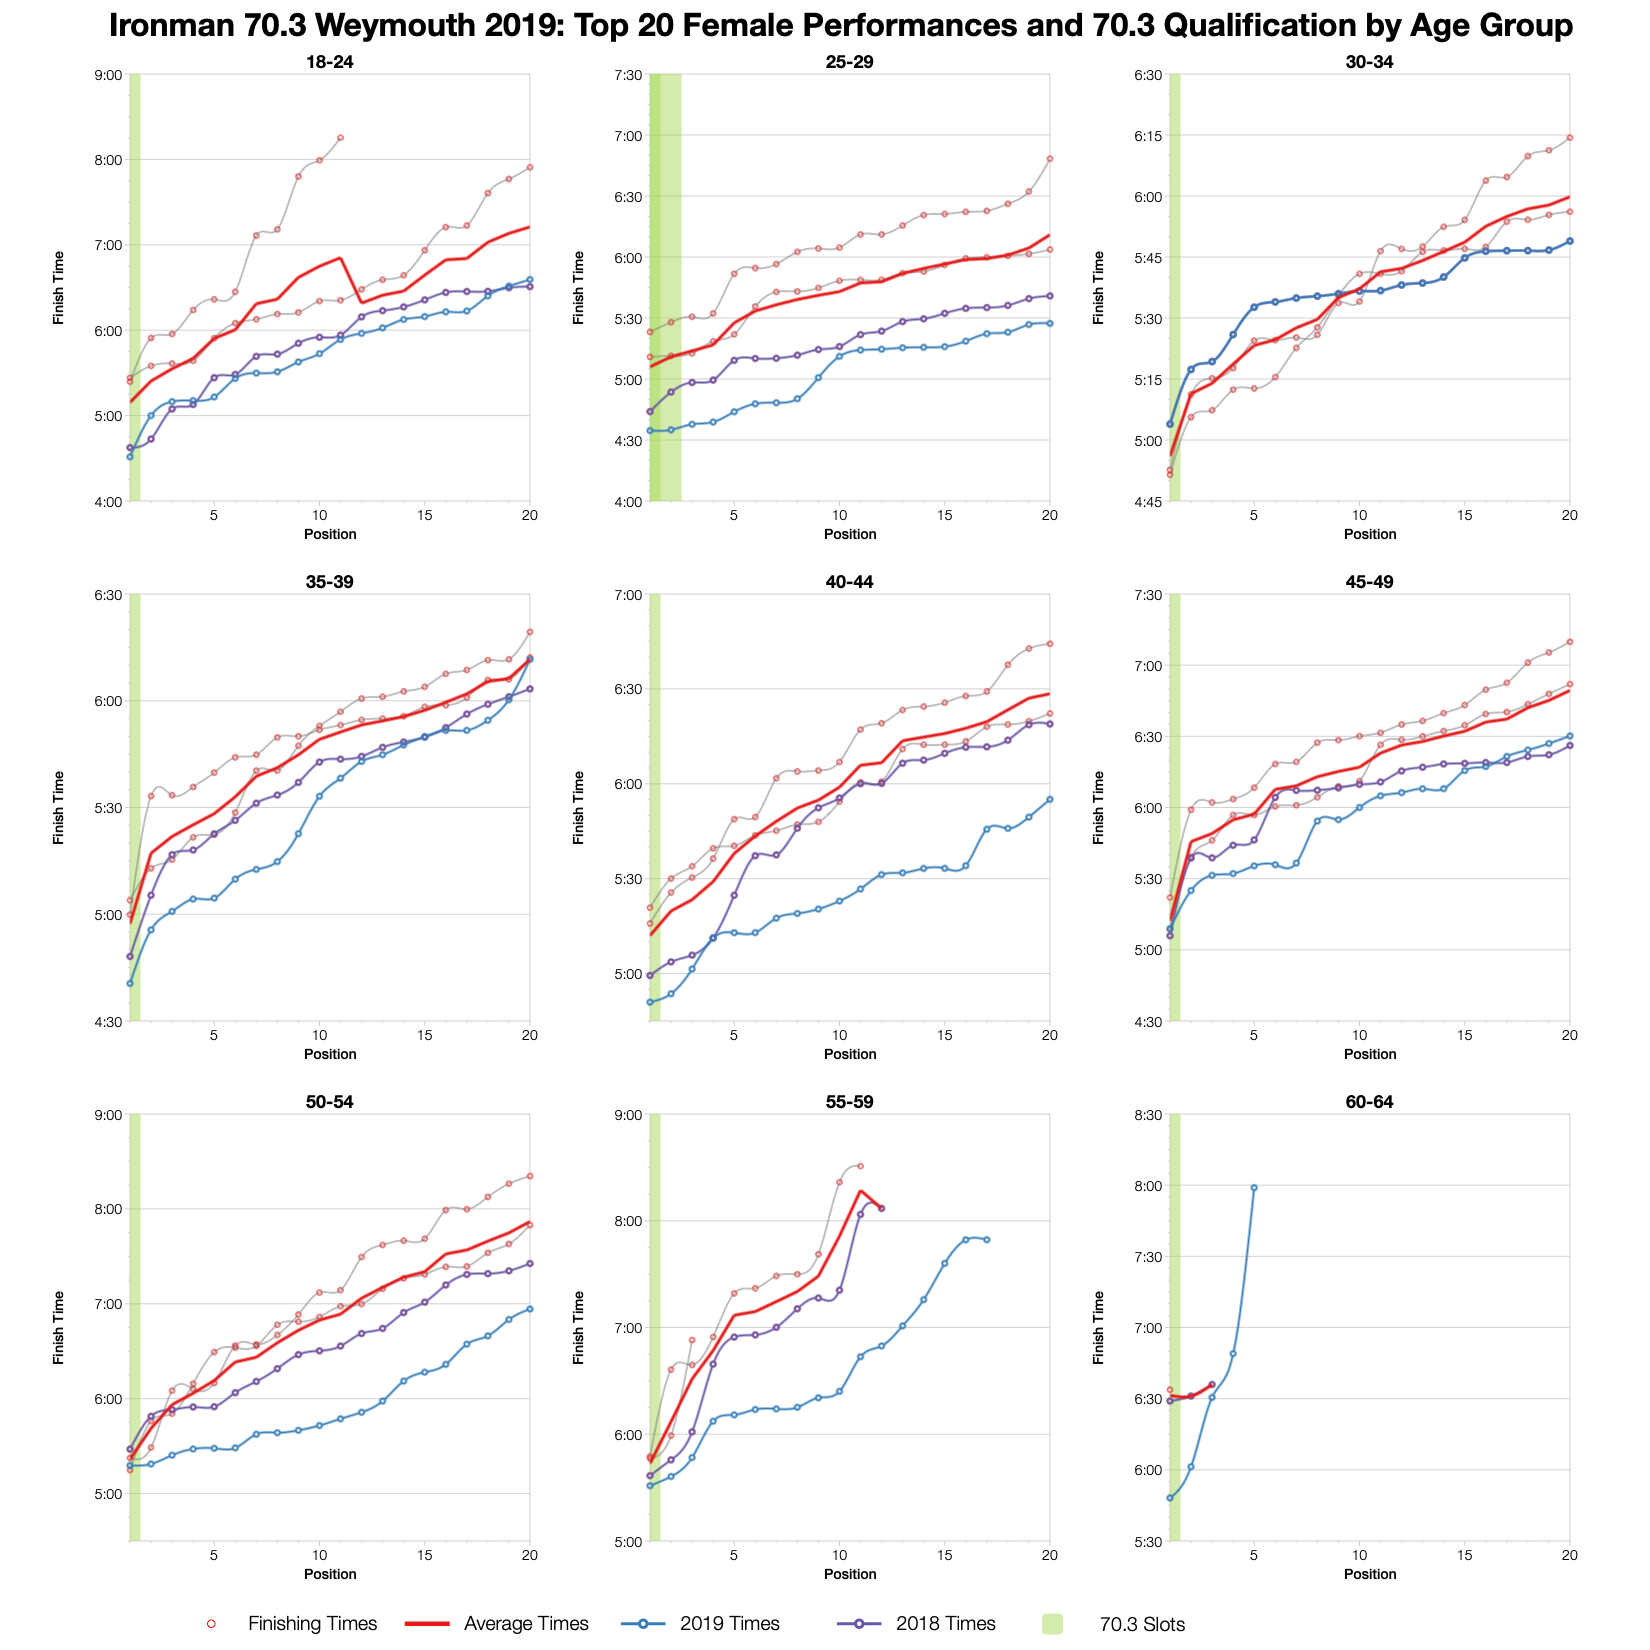
As we’d expect the shortened swim ensures this year’s race is much faster than the averages. 2019 has many of the fastest times in the top twenties. However, as the split distributions suggest, times would be much closer to average had the swim been full distance.
You can access a spreadsheet of the full results from Ironman 70.3 Weymouth 2019 on my Google Drive.