

Ironman South Africa 2019: Age Group Results and Kona Qualification
The first championship race of the Ironman season is Ironman South Africa. The race is mid-sized with around 1,800 competitors, but with 80 Kona slots on offer there’s usually a strong field of age group qualifiers. The course itself tends to be windy and tough, this year is no exception to that rule with strong winds and a shortened swim on the day. As the course had to be adjusted it’s hard to make direct comparisons with previous races.
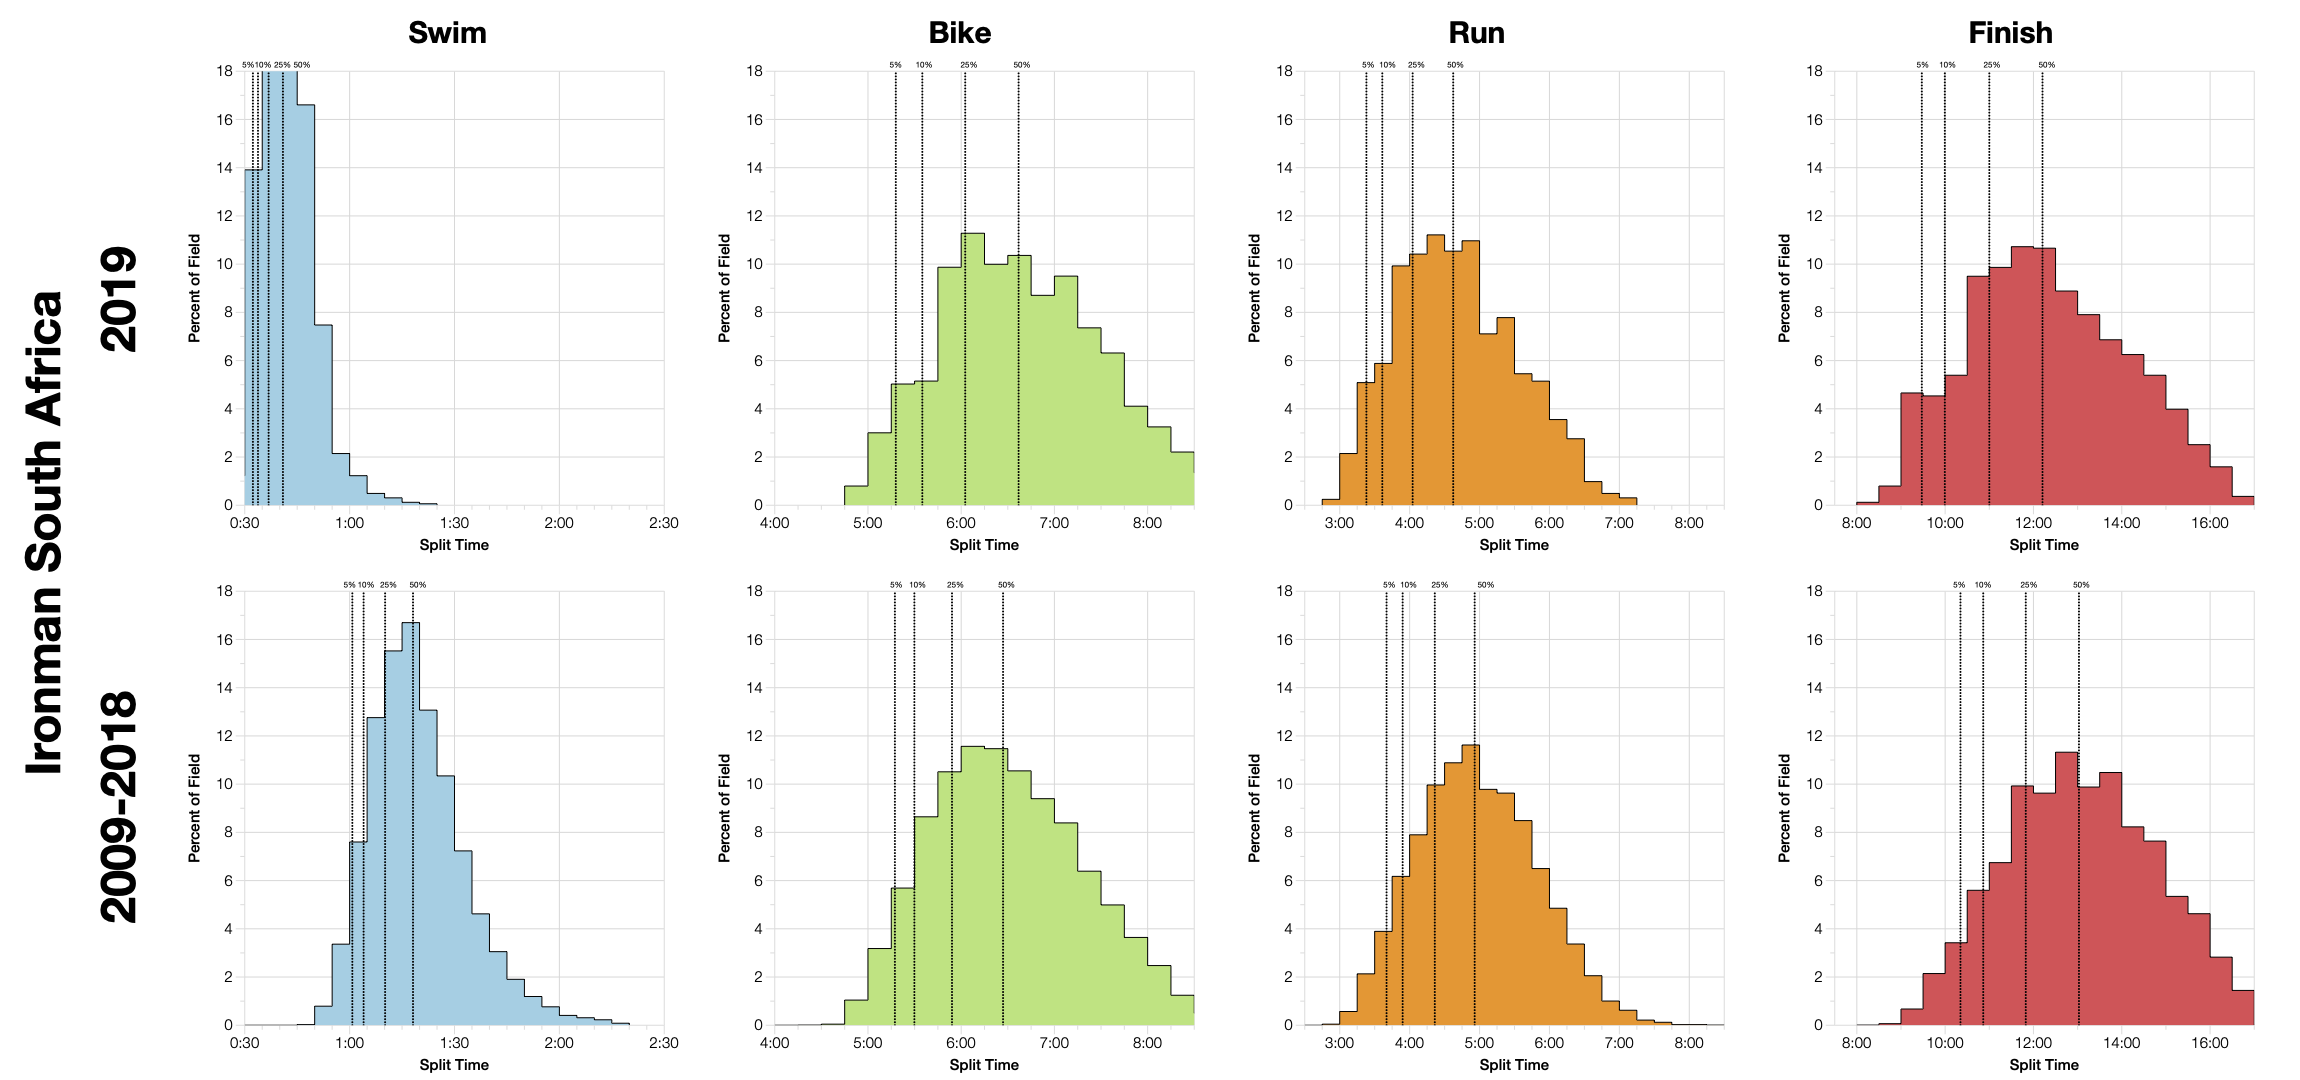
We can’t compare the swim times with older races – a shortened swim is obviously faster. Bike and run can be compared though. This years race had a slower bike and a faster run. Wind is a big factor on the course and the athletes I had racing there reported strong winds. This likely accounts for the slower bike. I’m not so sure what led to faster urn splits though. The run and bike balance each other out and with the short swim the overall times naturally trend faster.
DNF numbers fall inline with the last couple years of data for IMSA. Levels are around the average for Ironman courses, certainly nothing exceptional. Note that red rows in the table have questionable data that doesn’t make DNF clear or mixes it with DNS figures.
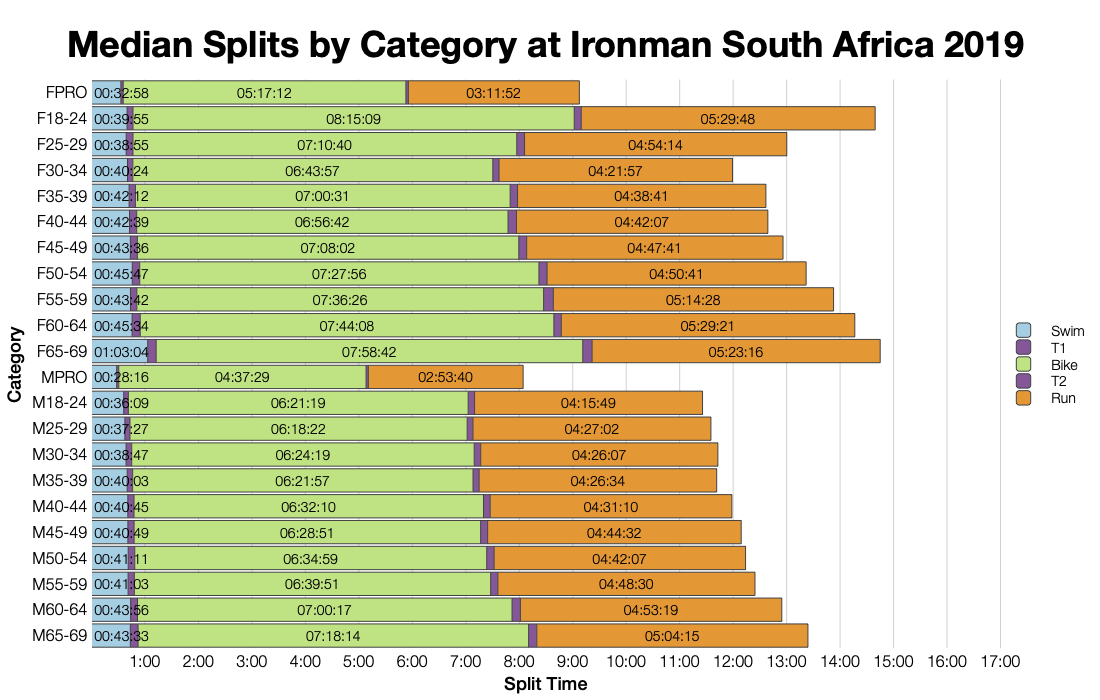
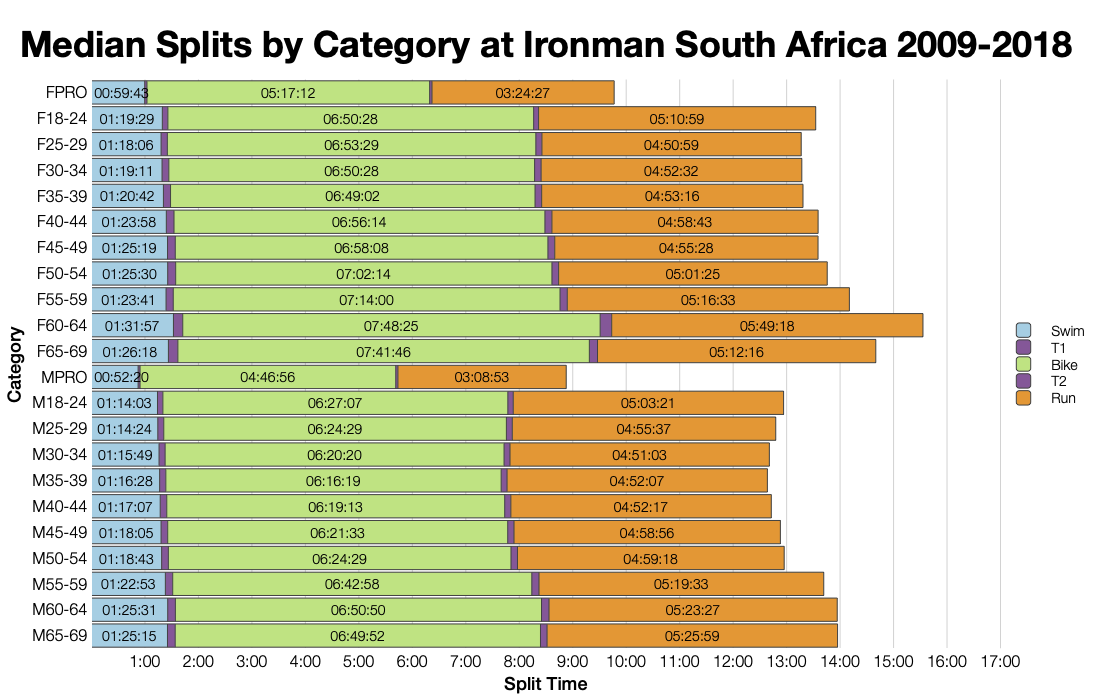
Medians follow the trends shown in the distributions. skipping the swim, we tend to have slower bikes and faster runs at this year’s race.
South Africa draws competitors from around the world and this is shown with the wide range of nationalities of potential Kona qualifiers. While the biggest portion stay at home, it’s much less than the percentage of competitors.
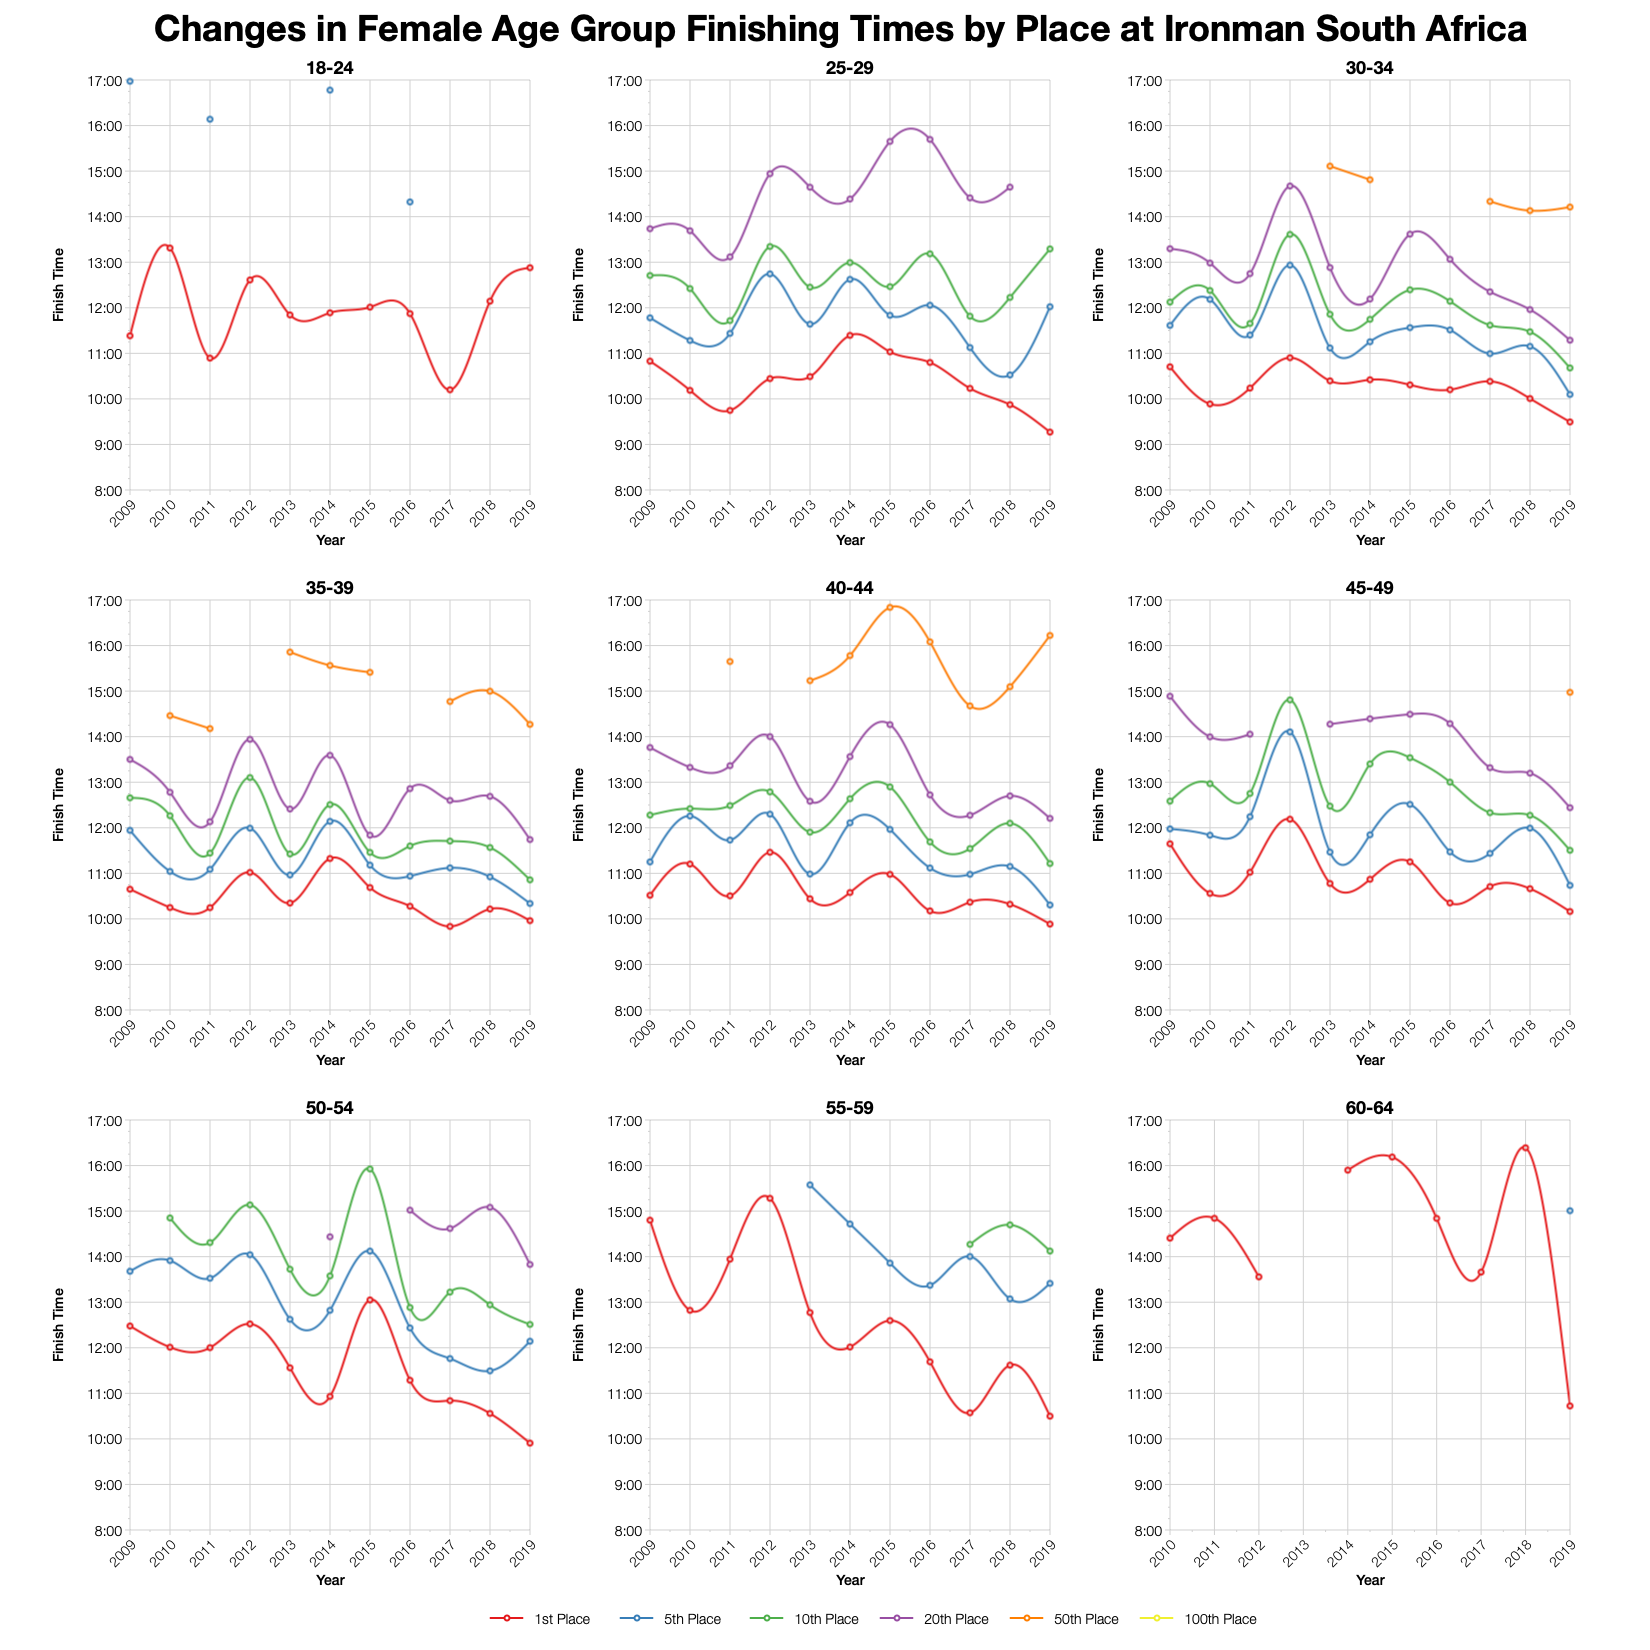
One big element to bear in mind with comparisons with the past is the changes that have been made to the course. This year’s conditions aside, the bike course has been changed in previous years. Looking towards the most recent results times are fairly consistent over the last 3 years. The fact that with a shortened swim this years race isn’t much faster still shows conditions must have been on the slow side. The course is also generally faster now than 5 to 10 years ago.
Based on the athlete numbers I’ve calculated the likely Kona slot allocation for the race and from that the automatic qualification times in each age group. Exact numbers may vary and roll down is not taken into account. You can compare this with other races on my Kona qualification page.
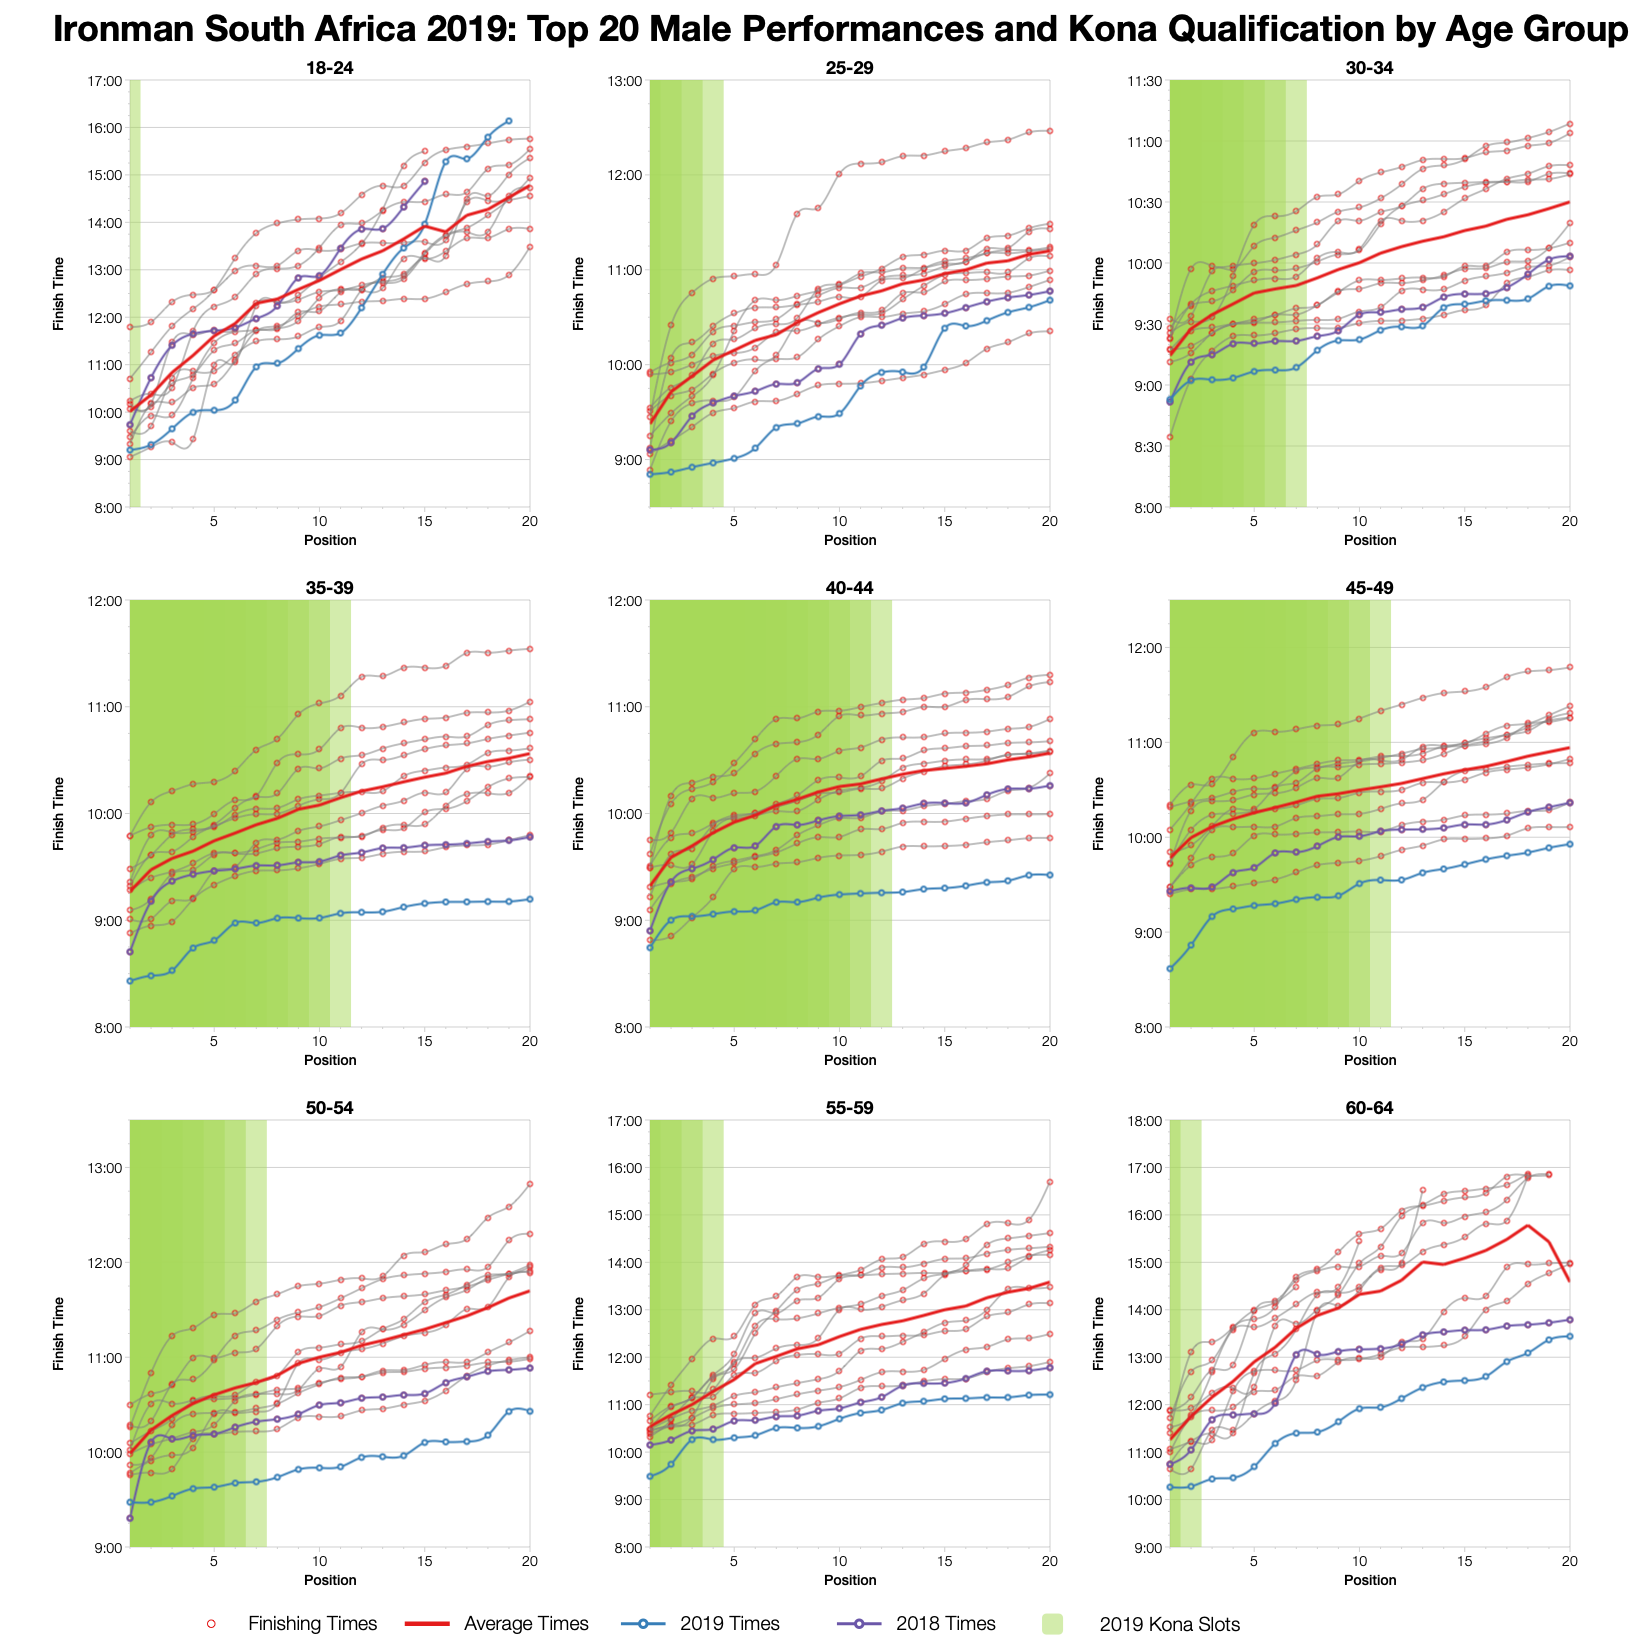
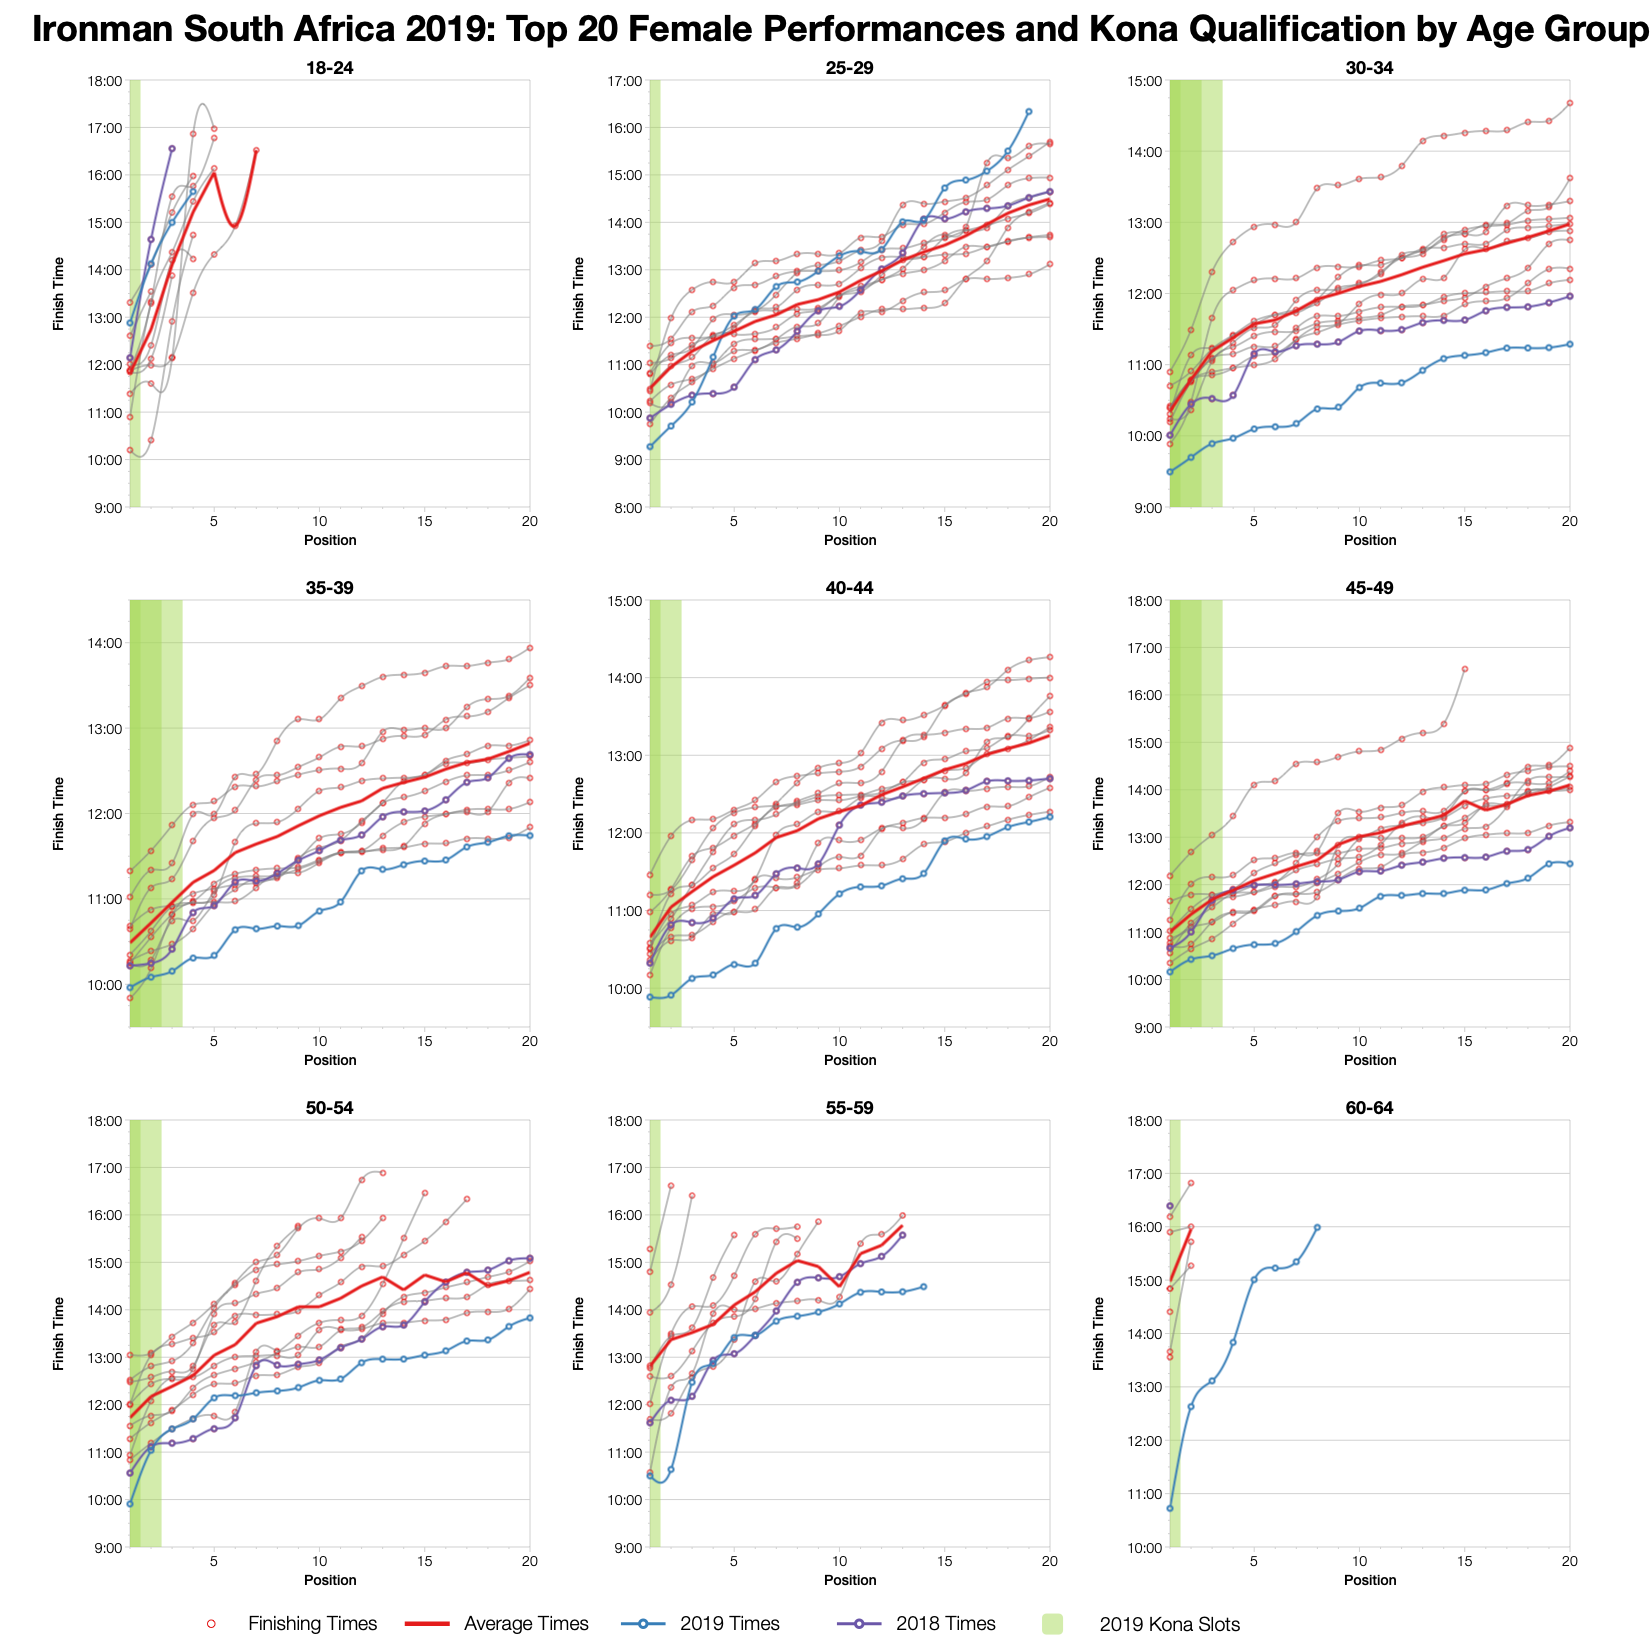
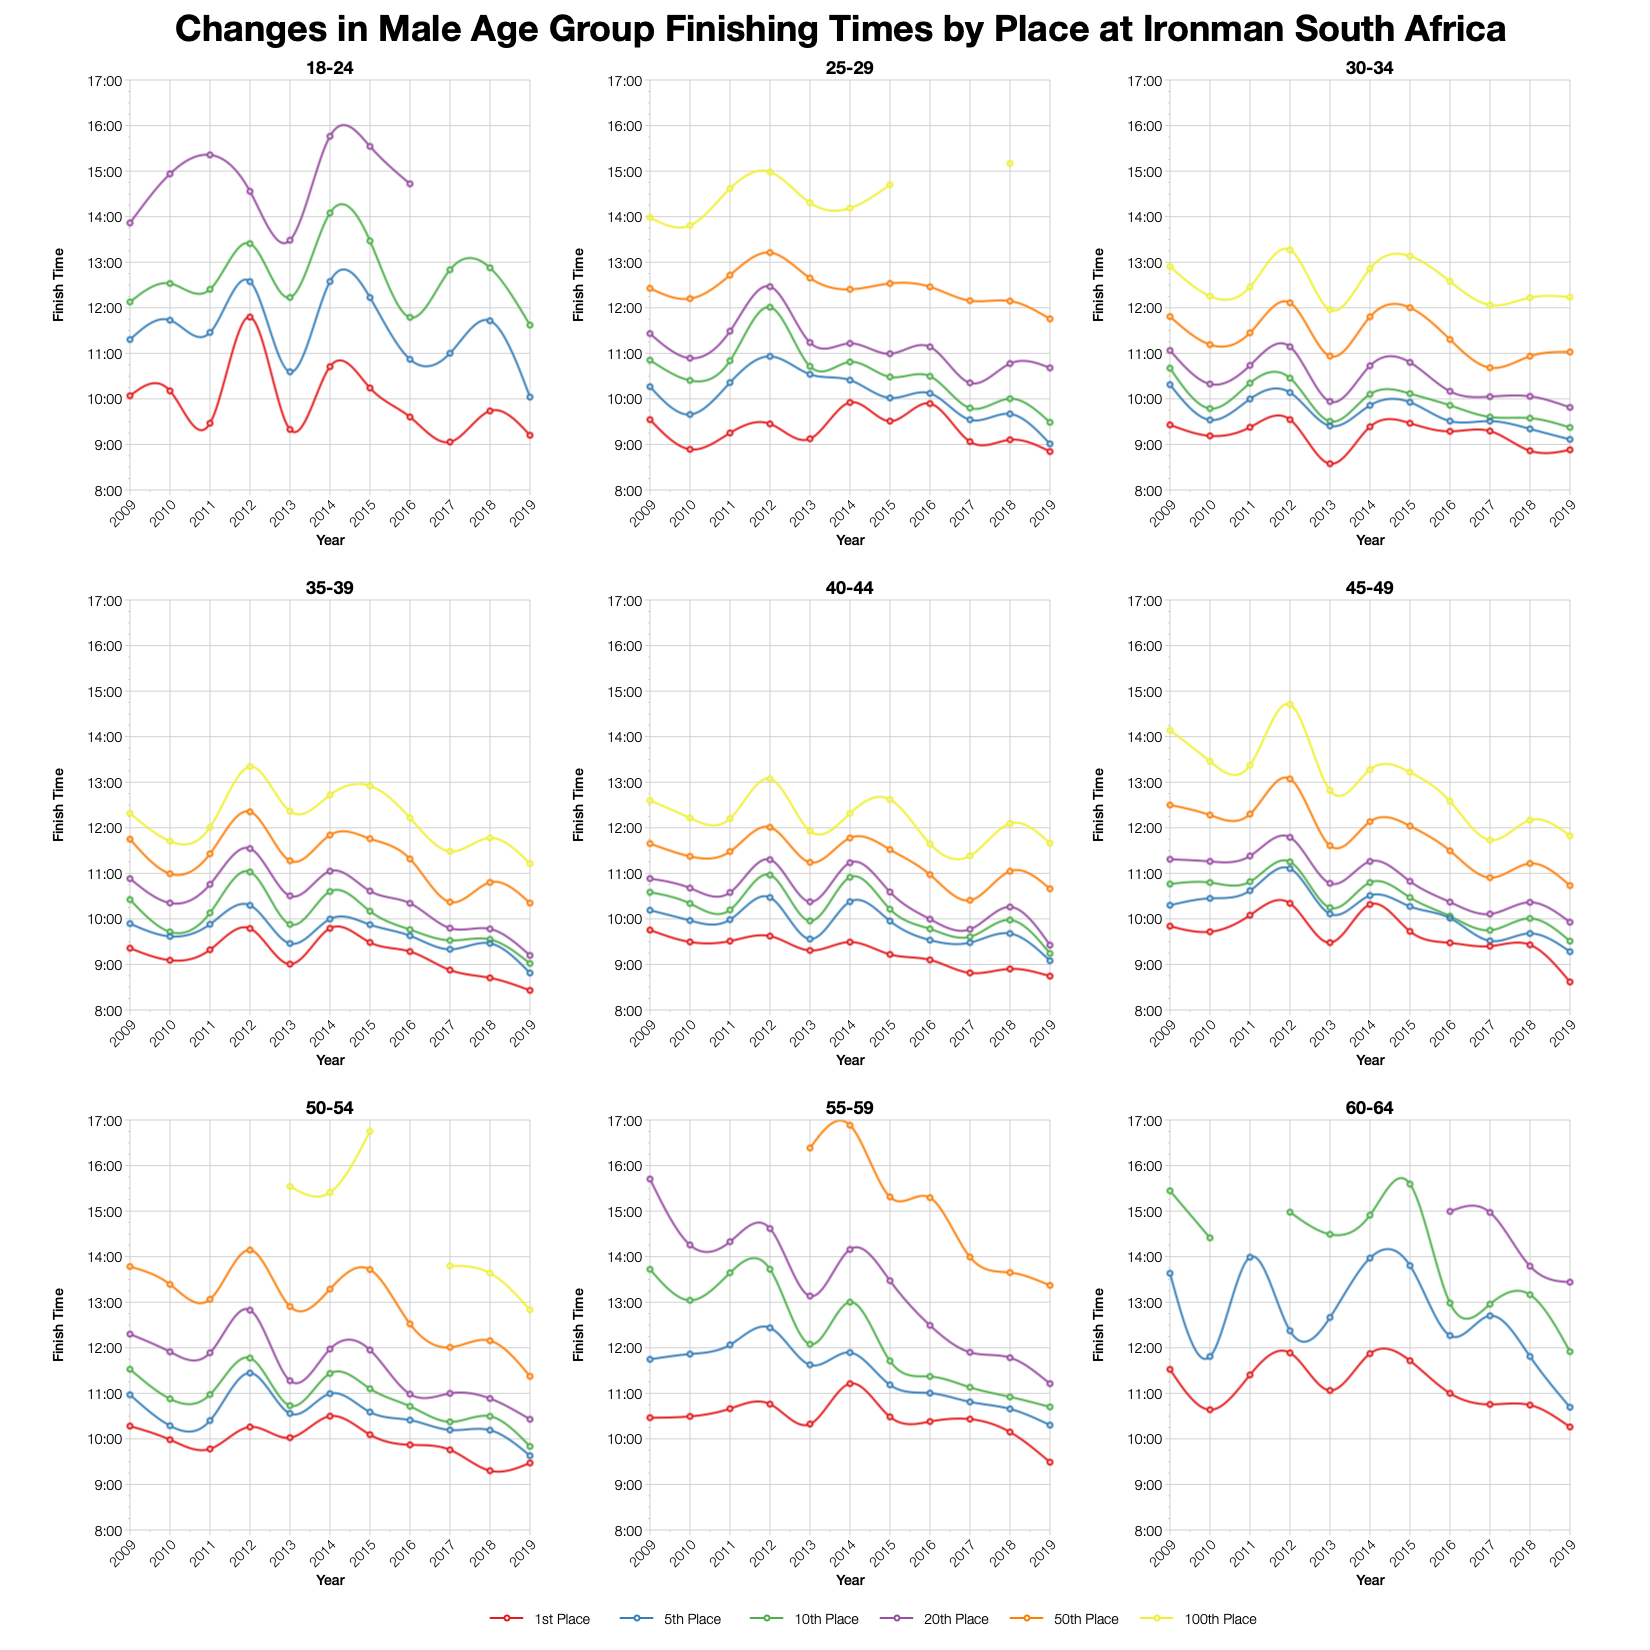
Finally, the top twenty in each age group. Again, the shortened swim means this year’s times are the fastest for the course in the last decade. What’s of note is that even with a shorter swim they are not universally the fastest and perhaps not much faster than the more recent years of racing on the new course. Conditions seem to have limited the gains made from less time in the water.
You can access a spreadsheet of the full results from Ironman South Africa 2019 on my Google Drive.
The post Ironman South Africa 2019: Age Group Results and Kona Qualification appeared first on CoachCox.